My-Portfolio
Donald-Chishakwe’s-Projects
Project 1: Enduro-Bike-Co-Analytics
Enduro Bike Co aims to improve its sales performance by analyzing two years’ worth of historical sales data. This project involves creating a structured data model, calculating critical KPIs, and visualizing insights using Power BI.
Key Performance Indicators:
Total Sales Amount (Current Year VS Prior Year)
Average Sales Amount per Transaction (Current Year VS Prior Year)
Number of Transactions (Current Year VS Prior Year)
Other Visualizations:
⏱ KPI Trends/Distribution
📋 Detailed KPI Breakdown
💡 KPI Decomposition


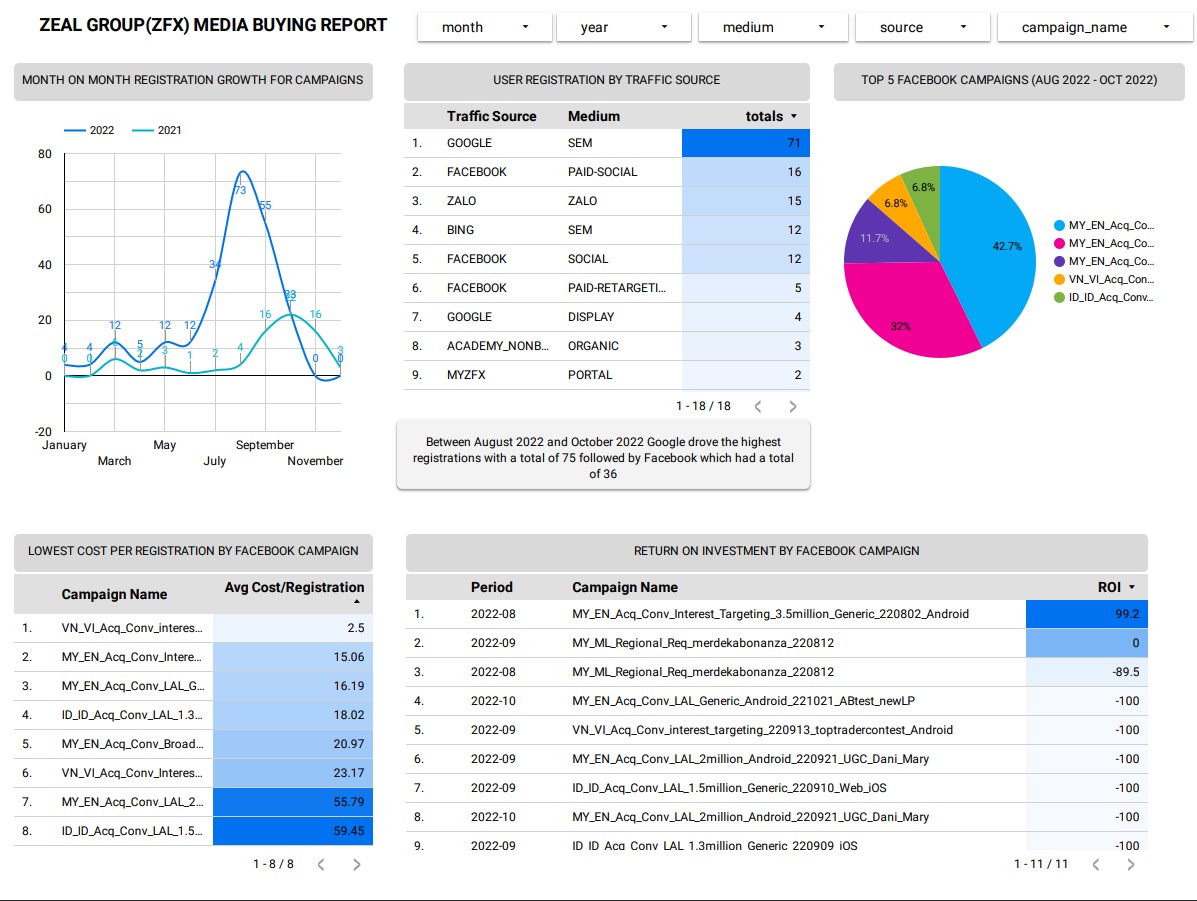
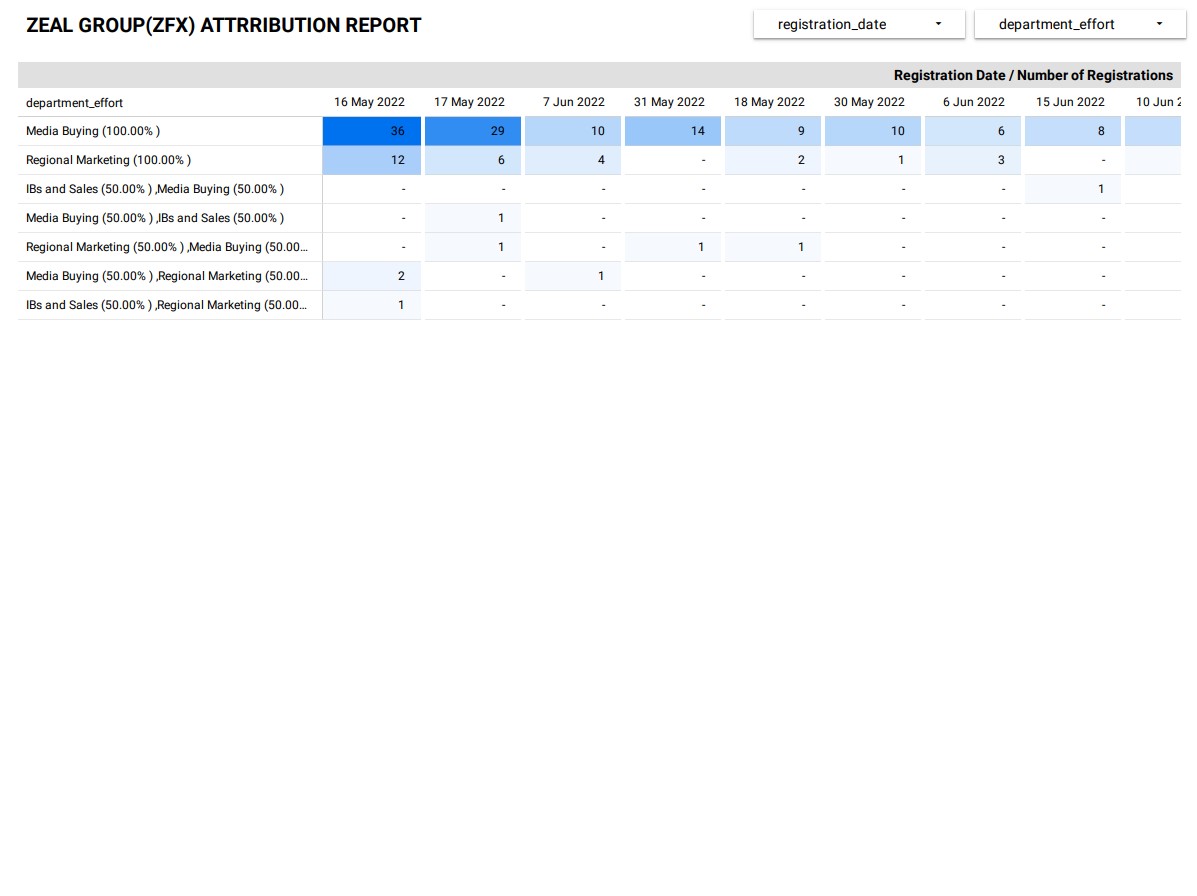
Project 2: Data Studio/Big Query Social Madia Campaign Analytics Report
I developed a Data Studio report that leveraged SQL queries in analysing a Big Query dataset for a stakeholder. The stakeholder’s objective was to monitor the number of registrations and growth percentage associated with Facebook and Google campaigns and make a comparison between their performance in 2021 and 2022. Business areas/questions to be addressed for the media buying team included:
- Month on month registration growth for Facebook & Google Campaigns per year.
- The traffic source that drove max registrations from August 2022 to October 2022.
- Top 5 Facebook Campaigns that drove the highest number of registrations from August 2022 to October 2022.
- Facebook Campaigns that drove the lowest cost per registration from August 2022 to October 2022.
- Showing the campaigns that drove the highest ROI % (Cost VS Net Deposit).
CLICK HERE TO VIEW THE SQL SCRIPTS USED